
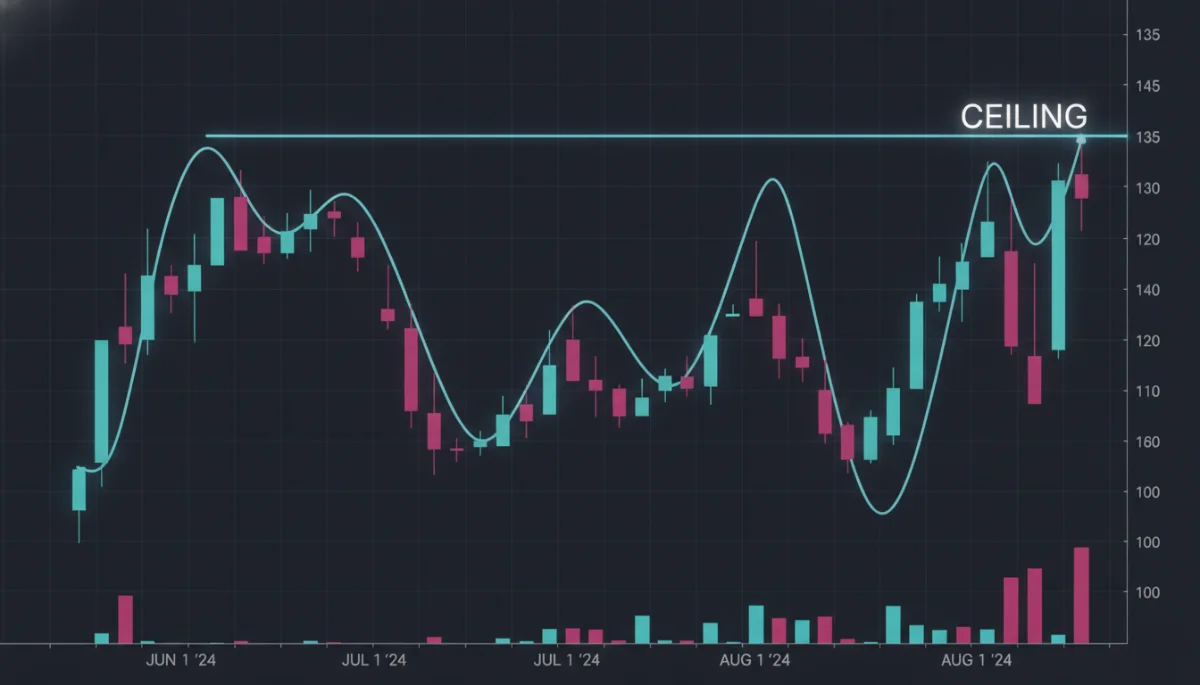
Ethereum is locked in a critical standoff at the $1,800 level, with its price hovering around $1,779 as of July 13, 2026, making this barrier the focal point of the crypto market’s summer trajectory.
Why $1,800 Is Not Just a Number
The $1,799–$1,800 zone acts as a formidable technical wall, combining the daily pivot point, the 50-day Exponential Moving Average (EMA50), and a cluster of short-term resistance levels on hourly charts.
For Ethereum to break out, it needs a decisive, volume-backed close above $1,800—otherwise, bears will continue suppressing the price to exhaust buyers.
Timeframe Dissonance: Daily Hope vs. Hourly Fear
On the daily chart, Ethereum shows signs of recovery: it’s holding above the 20-day EMA, and the MACD has just signaled a bullish crossover, hinting that selling pressure may be fading.
However, on 1-hour and 15-minute charts, the market is clearly bearish. Sellers are aggressively defending $1,800, and the Relative Strength Index (RSI) is nearing oversold territory.
This mismatch creates a treacherous environment for traders: buying without a confirmed breakout is like running into a headwind.
Bitcoin’s Dominance and the Fear Environment
Bitcoin dominance stands at roughly 56%, limiting altcoins’ ability to gain independent momentum.
In this risk-off climate, capital flows to perceived safety—Bitcoin. With geopolitical tensions and macroeconomic uncertainty (including interest rate speculation), the Fear & Greed Index sits at 28, firmly in the “Fear” zone.
When fear dominates, investors seek liquidity and exits, not value in altcoins like Ethereum.
On-Chain Activity: Repositioning or Panic?
Decentralized Exchange (DEX) activity has surged sharply: Uniswap V3 fees jumped nearly 49%, and Curve DEX is seeing a similar volume spike.
Rising fees during a downturn usually signal active repositioning, not new buying. Investors are likely moving tokens to cold storage, rebalancing portfolios, or hedging against further downside.
This suggests the market is twitchy, with participants bracing for volatility rather than chasing a bull run.
Two Possible Paths for Ethereum
Bullish Breakout Scenario
- A sustained hourly close above $1,800 could trigger a short-squeeze, forcing bears to buy back positions and creating a self-fulfilling pump.
- This would open the path to $1,825, with potential to test upper Bollinger bands near $1,884.
Bearish Slide Scenario
- If $1,800 holds and support at $1,753 breaks, momentum evaporates.
- Below $1,753 lies a “structural vacuum” with little historical buying interest, potentially causing rapid price drops.
- In a fear-driven market, losing this floor could trigger technical selling that shakes even hardened holders.
The Right Strategy: Patience Over Panic
The clearest advice for traders and investors: Don’t fight the range.
Trading between $1,753 and $1,800 is a high-risk, low-reward game. Without a confirmed breakout, flipping coins is essentially betting on chance rather than strategy.
Waiting for a decisive close above $1,800—or a confirmed breakdown below $1,753—offers far better risk management in this volatile regime.